Java生产环境下性能监控与调优详解,主要讲解的是性能监控、调优、JVM详解、代码层优化
基于JDK命令行工具的监控
JVM参数类型
标准参数
- -help
- -server -client
- -version -showversion
- -cp -classpath
x参数 非标准化参数
-Xint: 解释执行
1
2
3
4
java -Xint -version
openjdk version "10.0.2" 2018-07-17
OpenJDK Runtime Environment (build 10.0.2+13-Ubuntu-1ubuntu0.18.04.3)
OpenJDK 64-Bit Server VM (build 10.0.2+13-Ubuntu-1ubuntu0.18.04.3, interpreted mode)-Xcomp: 第一次使用就编译成本地代码
1
2
3
4
java -Xcomp -version
openjdk version "10.0.2" 2018-07-17
OpenJDK Runtime Environment (build 10.0.2+13-Ubuntu-1ubuntu0.18.04.3)
OpenJDK 64-Bit Server VM (build 10.0.2+13-Ubuntu-1ubuntu0.18.04.3, compiled mode)-Xmixed: 混合模式,JVM自己来决定是否编译成本地代码,默认使用
1
2
3
4
java -version
openjdk version "10.0.2" 2018-07-17
OpenJDK Runtime Environment (build 10.0.2+13-Ubuntu-1ubuntu0.18.04.3)
OpenJDK 64-Bit Server VM (build 10.0.2+13-Ubuntu-1ubuntu0.18.04.3, mixed mode)
xx参数
非标准化参数
相对不稳定
主要用于JVM调优的Debug
Boolean类型
格式: -XX:[+-]\
表示启用或者禁用name属性 比如: -XX:+UseConcMarkSweepGC启动CMS垃圾收集器 -XX:+UseG1GC启动G1垃圾收集器
非Boolean类型
格式: -XX: \
= \ 表示name属性的值是value 比如: -XX: MaxGCPauseMillis=500GC的最大停顿时间500ms -XX:GCTimeRatio=19
-Xmx -Xms
不是X参数,而是XX参数
-Xms等价于-XX:InitialHeapSize: 初始化堆大小
-Xmx等价于-XX:MaxHeapSize: 最大的堆大小
查看JVM运行时参数
-XX:+PrintFlagsInitial 查看初始值
-XX:+PrintFlagsFinal 查看最终值
=表示默认值,:=被用户或者JVM修改后的值
-XX:+UnlockExperimentalVMOptions 解锁实验参数 使用这个才可以赋值
-XX:+UnlockDiagnosticVMOptions 解锁诊断参数
-XX:+PrintCommandLineFlags打印命令行参数
jps
1
2
3
4
5
6
[lzh@localhost bin]$ jps -help
usage: jps [-help]
jps [-q] [-mlvV] [<hostid>]
Definitions:
<hostid>: <hostname>[:<port>]1
2
3
4
5
6[root@localhost bin]# jps
1819 Jps # 命令本身
1651 Bootstrap # Tomcat
[root@localhost bin]# jps -l #-l 参数可以知道完全类名
1651 org.apache.catalina.startup.Bootstrap
1859 sun.tools.jps.Jpsjinfo
查看已经正在运行的JVM的参数值
1
2
3
4
5
6
7
8
9
10
11
12
13
14
15[root@localhost bin]# jinfo -flag MaxHeapSize 1651 #查看最大内存
-XX:MaxHeapSize=853540864
[root@localhost bin]# jinfo -flags 1651 #打印已经被手动赋过值得参数信息
Attaching to process ID 1651, please wait...
Debugger attached successfully.
Server compiler detected.
JVM version is 24.75-b04
-Djava.util.logging.config.file=/usr/program/tomcat-7/conf/logging.properties -Djava.util.logging.manager=org.apache.juli.ClassLoaderLogManager -Djdk.tls.ephemeralDHKeySize=2048 -Dignore.endorsed.dirs= -Dcatalina.base=/usr/program/tomcat-7 -Dcatalina.home=/usr/program/tomcat-7 -Djava.io.tmpdir=/usr/program/tomcat-7/temp
[root@localhost bin]# jinfo -flag UseConcMarkSweepGC 1651 # 查看GC
-XX:-UseConcMarkSweepGC
[root@localhost bin]# jinfo -flag UseG1GC 1651
-XX:-UseG1GC
[root@localhost bin]# jinfo -flag UseParallelGC 1651
-XX:+UseParallelGCjstat查看JVM统计信息
1
2
3
4
5
6
7
8
9
10
11
12
13
14
15
16
17
18
19
20
21
22
23
24
25
26
27
28
29
30
31
32
33
34
35[root@localhost bin]# jstat -help
Usage: jstat -help|-options
jstat -<option> [-t] [-h<lines>] <vmid> [<interval> [<count>]]
Definitions:
<option> An option reported by the -options option
<vmid> Virtual Machine Identifier. A vmid takes the following form:
<lvmid>[@<hostname>[:<port>]]
Where <lvmid> is the local vm identifier for the target
Java virtual machine, typically a process id; <hostname> is
the name of the host running the target Java virtual machine;
and <port> is the port number for the rmiregistry on the
target host. See the jvmstat documentation for a more complete
description of the Virtual Machine Identifier.
<lines> Number of samples between header lines.
<interval> Sampling interval. The following forms are allowed:
<n>["ms"|"s"]
Where <n> is an integer and the suffix specifies the units as
milliseconds("ms") or seconds("s"). The default units are "ms".
<count> Number of samples to take before terminating.
-J<flag> Pass <flag> directly to the runtime system.
[root@localhost bin]# jps
2070 Jps
1651 Bootstrap
[root@localhost bin]# jstat -class 1651 # 查看类加载信息
Loaded Bytes Unloaded Bytes Time
2381 4883.4 0 0.0 0.93
[root@localhost bin]# jps -l
1547 sun.tools.jps.Jps
1500 org.apache.catalina.startup.Bootstrap
[root@localhost bin]# jstat -gc 1500 1000 3
S0C S1C S0U S1U EC EU OC OU MC MU CCSC CCSU YGC YGCT FGC FGCT GCT
2048.0 2048.0 2032.0 0.0 53248.0 17027.9 35840.0 16405.3 16512.0 15932.5 1920.0 1764.4 4 0.039 0 0.000 0.039
2048.0 2048.0 2032.0 0.0 53248.0 17027.9 35840.0 16405.3 16512.0 15932.5 1920.0 1764.4 4 0.039 0 0.000 0.039
2048.0 2048.0 2032.0 0.0 53248.0 17027.9 35840.0 16405.3 16512.0 15932.5 1920.0 1764.4 4 0.039 0 0.000 0.039-gc输出结果:
S0C、S1C、S0U、S1U:S0区和S0区的总量和使用量
EC、EU:Eden区总量和使用量
OC、OU:Old区总量和使用量
MC、MU:Metaspace区总量和使用量
CCSC、CCSU:压缩类空间总量和使用量
YGC、YGCT:YoungGC的次数和时间
FGC、FGCT:FullGCC的次数和时间
GCT:总的GC时间
JIT编译
1
2
3
4
5
6
7
[root@localhost /]# jps -l
1472 org.apache.catalina.startup.Bootstrap
1570 org.elasticsearch.bootstrap.Elasticsearch
1679 sun.tools.jps.Jps
[root@localhost /]# jstat -compiler 1472
Compiled Failed Invalid Time FailedType FailedMethod
1734 0 0 1.70 0
导出内存映像文件
内存溢出自动导出
设置参数:
1 | -XX:+HeapDumpOnOutOfMemoryError |
使用jmap命令导出
当内存使用过大时,适合使用jmap来导出内存映像文件
1 | 李正浩@DESKTOP-NLE0CLO MINGW64 ~/Desktop |
MAT分析内存溢出
查看对象数量、查看对象占用的内存数量
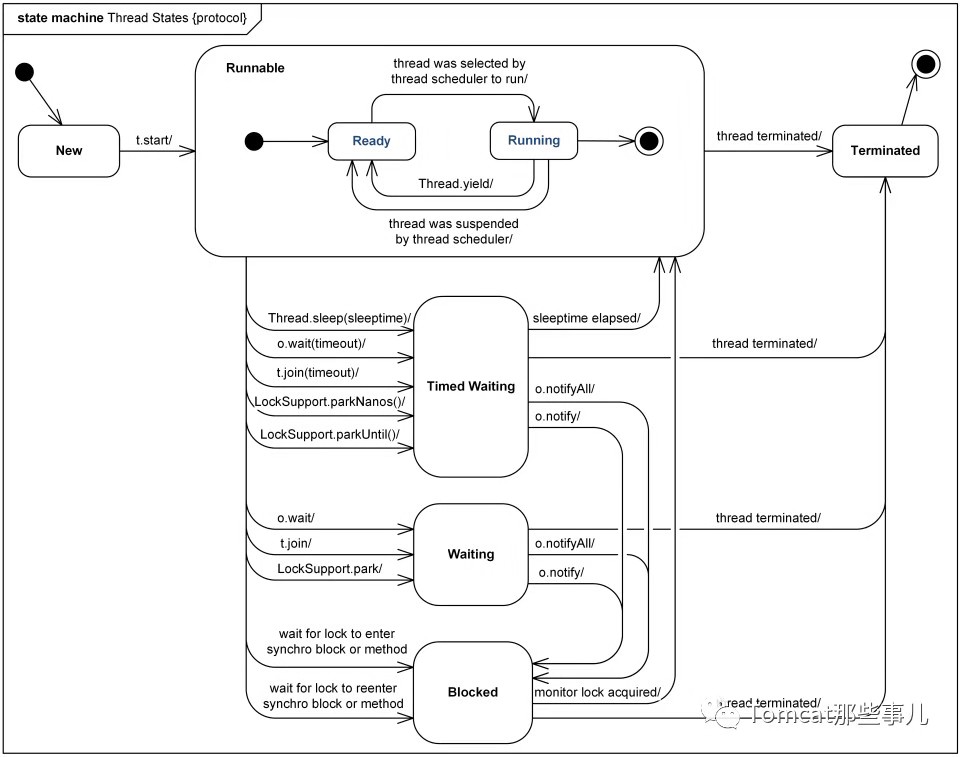
jstack
打印JVM里面的所有的线程,会显示每一个线程的运行状态以及堆栈信息
线程状态
NEW:新建,没有调用start()方法
RUNABLE:运行在JVM中
BLOCKED: 阻塞 等待一个锁
WAITING:等待其他线程
TIMED_WAITING:超时等待
TERMINATED:终止
基于JVisualVM的可视化监控
监控本地Java进程
D:\Java\jdk1.8.0_151\bin\jvisualvm.exe,可以查看本地的进程信息,同时也可以使用插件来进行查看,不过要和JDK的版本信息相对应使用,例如:Visual GC,可以查看内存的结构分布。通过图形化方式查看
监控远程Java进程
在D:\Java\jdk1.8.0_151\bin\jvisualvm.exe中有远程连接,可以直接连接到远程的主机
修改Tomcat的catalina.sh里面的配置
1
JAVA_OPTS="$JAVA_OPTS $JSSE_OPTS -Dcom.sun.management.jmxremote -Dcom.sun.management.jmxremote.port=9004 -Dcom.sun.management.jmxremote.authenticate=false -Dcom.sun.management.jmxremote.ssl=false -Djava.net.preferIPv4Stack=true -Djava.rmi.server.hostname=192.168.65.128 "
添加JMX连接 9004端口
监控远程普通Java进程
设置如下启动参数,然后远程连接JMX端口即可
1 | nohup java -Dcom.sun.management.jmxremote -Dcom.sun.management.jmxremote.port=9004 -Dcom.sun.management.jmxremote.authenticate=false -Dcom.sun.management.jmxremote.ssl=false -Djava.net.preferIPv4Stack=true -Djava.rmi.server.hostname=192.168.65.128 -jar xxxx.jar & |
基于Btrace的监控调试
Btrace可以动态的向目标应用程序的字节码注入追踪代码,只能在本机进行执行
JavaComplierApi、JVMTI、Agent、Instrumentation+ASM
安装
安装网站下载安装包
新建环境变量BTRACE_HOME
添加Path:%BTRACE_HOME%\bin
运行
两种方式脚本运行
1、JVisualVM中添加Btrace插件,添加classpath
2、使用命令行btrace \
\ 3、在脚本加上@Btrace
拦截构造函数、同名函数
拦截方法
- 普通方法:@OnMethod(clazz=””, method=””)
- 构造方法:@OnMethod(clazz=””, method=”\
“) - 拦截同名函数:用参数区分
拦截时机
@OnMethod中可以进行配置location属性即location=@Location(Kind.RETURN),可以配置拦截的时机,方便打印出信息,默认值为Kind.ENTRY,同时还要在脚本的执行中加入@Return AnyType注解,打印出即可(@Return代表是一个返回值)。只要是一个类的方法都可以进行拦截
- Kind.ENTRY:入口,默认值
- Kind.RETURN:返回
- Kind.THROW:异常
- Kind.Line:行
拦截this、参数、返回值
- this:@Self
- 入参:可以使用AnyType,也可以使用真实类型,同名的使用真实的类型
- 返回值:可以使用Kind.RETURN进行拦截返回
- 获取对象的值:简单类型,直接获取;复杂类型,反射、类名+属性名
其他
Tomcat的性能监控与调优
tomcat远程debug
JDWP
1、修改Tomcat下面的bin的配置文件 startup.sh里面最后加入exec “$PRGDIR”/“$EXECUTABLE” start “$@” 改为
exec “$PRGDIR”/“$EXECUTABLE” jpda start “$@”
2、在catalina.sh文件中JPDA_ADDRESS=”8000”为监听端口为8000
3、启动Tomcat即可
tomcat优化
内存优化
线程优化
Tomcat8 采用NIO多路复用优化,地址:/doc/config/http.html
- maxConnections:Tomcat能够接受和处理的最大的连接数
- acceptCount:连接压入队列中,允许的队列数
- maxThreads:工作线程,同一个时间点处理的并发的线程数
- minSpareThreads: 最小空闲的工作线程
配置优化
- autoDeploy:说明Tomcat正在运行时要不要周期性的检查Tomcat应用,true表示会周期性的检查,默认为true,会影响性能,生产环境下要改为false,在server.xml中修改
- enableLookups:如果调用
request.getRemoteHost()进行DNS查询,就设置为true,生产环境设置为false - reloadable:设置为false,如果想Tomcat来进行监控应用下面的class文件的变化,就设置为true,会重新载入,会影响性能,所以需要设置为false
- protocol=”org.apache.coyote.http11.HttpAprProtocol” 大并发场合: 设置协议 conf/server.xml中
Session优化
- 如果是JSP,可以禁用Session,占用内存,Session存入Redis中
Nginx性能监控与调优
反向代理和负载均衡服务器
ngx_http_stub_status监控连接信息
添加配置
编译时是否编译进入 查看编译参数
2
>
2
3
4
5
6
7
stub_status on;
access_log off;
allow 127.0.0.1; #只允许本机访问
deny all; # 其他拒绝
}
>
ngxtop监控请求信息
1、安装python-pip
2
3
> yum install python-pip
>
>
2、安装ngxtop
2
>
>
官方文档地址https://github.com/lebinh/ngxtop
3、使用
2
3
4
5
6
7
8
9
ngxtop [options]
ngxtop [options] (print|top|avg|sum) <var>
ngxtop info
ngxtop -c /etc/nginx/nginx.conf #指定配置文件
ngxtop -c /etc/nginx/nginx.conf -i 'status == 200' #查看状态是200
ngxtop -c /etc/nginx/nginx.conf -g remote_addr #查看访问最多IP
nginx-rrd图形化监控
Nginx优化
增加工作线程数和并发连接数
1
2
3
4
5
6work_proesses 4; #cpu 多少个cpu配置多少个工作线程
events {
worker_connections 10240; #每个进程打开的最大连接数,包含了Nginx和客户端与Nginx和upstream之间的连接 受限于系统配置
multi_accept on; #可以一次建立多个连接
use epoll; #带有事件回调的方式
}启用长连接
1
2
3
4
5
6
7
8
9
10
11upstream server_pool {
server localhost:8080 weight=1 max_fails=2 fail_timeout=30s;
server localhost:8081 weight=1 max_fails=2 fail_timeout=30s;
keepalive 300; #300个长连接
}
location / {
proxy_http_version 1.1;
proxy_set_header Upgrade $http_upgrade;
proxy_set_header Connection "upgrade";
proxy_pass http://server_pool/;
}启用缓存和压缩
1
2
3
4
5
6
7gzip on;
gzip_http_version 1.1;
gzip_disable "MSIE[1-6]\.(?!.*SV1)";
gzip_proxied any;
gzip_types text/plain text/css application/javascript application/x-javascript application/json application/xml application/vnd.ms-fontobject application/x-font-ttf application/svg+xml application/x-icon;
gzip_vary on; #Vary: Accept-Encoding
gzip_static on; #如果有压缩好的 则直接使用操作系统优化
配置文件 /etc/sysctl.conf
1
2
3
4
5sysctl -w net.ipv4.tcp_syncookies=1 #防止一个套接字在有过多试图连接到达时引起过载
sysctl -w net.core.somaxconn=1024 #默认128 连接队列
sysctl -w net.ipv4.tcp_fin_timeout=10 #timewait的超时时间
sysctl -w net.ipv4.tcp_tw_reuse=1 #os直接使用timewait的连接
sysctl -w net.ipv4.tcp_tw_recycle=0 #回收禁用配置文件 /etc/security/limits.conf 每个线程打开的文件数的配置
1
2
3
4* hard nofile 204800
* soft nofile 204800
* soft core unlimited
* soft stack 204800其他优化
1
2
3
sendfile on; #减少文件在应用和内核之间拷贝
tcp_nopush on; #当数据包达到一定大小再发送
tcp_nodelay off; #有数据随时发送
JVM层GC调优
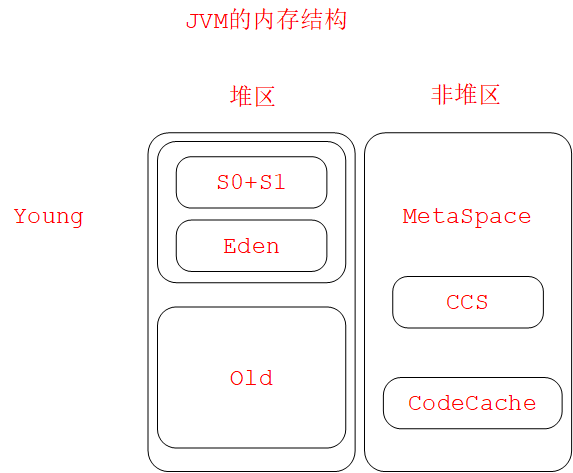
JVM的内存结构
运行时数据区
分为方法区、堆、虚拟机栈、本地方法栈程序计数器
- 程序计数器PC Register:JVM支持多线程同时运行,每个线程都有自己的PC Register,线程正在执行的方法叫当前方法,如果是Java代码,PC Register里面存放就是当前正在执行的指令的地址,如果是C代码,则为空
- 虚拟机栈JVM Stacks:Java虚拟机栈是线程私有的,它的生命周期和线程周期相同。虚拟机栈描述的是Java方法执行的内存模型:每个方法在执行的同时都会创建一个栈帧,用于存储局部变量、操作数栈、动态链接、方法出口等信息。每个方法从调用直至执行完成的过程,就对应一个栈帧在虚拟机栈中入栈到出栈的过程
- 堆Heap:Java堆(Java Heap)是Java虚拟机所管理的内存的最大的一块。堆是被所有线程共享的一块内存区域,在虚拟机启动时创建。此内存区域的唯一目的就是存放对象实例,几乎所有的对象实例都在这里分配内存。Java堆可以处于物理上不连续的内存空间中,只要逻辑上是连续的即可
- 方法区 Method Area:方法区和Java堆一样,是各个线程共享的内存区域,它用于存储已被虚拟机加载的类信息、常量、静态变量、即时编译器编译后的代码等数据。虽然Java虚拟机规范把方法区描述为堆的一个逻辑部分,但是它却有一个别名叫做Non-Heap(非堆),目的就是与Java堆区分开来
- 常量池Run-Time Constant Pool:运行时常量池是方法区的一部分。Class文件中除了有类的版本、字段、方法、接口等描述信息外,还有一项信息就是常量池,用于存放编译期生成的各种字面量信息和符号引用,这部分内容将在类加载后进入方法区的运行时常量池存放
- 本地方法栈Nativie Method Stacks:本地方法栈与虚拟机栈所发挥的的作用是非常相似的,它们之间的区别不过是虚拟机栈为虚拟机执行Java方法(也就是字节码)服务,而本地方法栈则为虚拟机使用到的Native方法服务
- MetaSpace=Class、Package、Method、Field、字节码、常量池、符号引用等等
- CCS:32位指针的Class
- CodeCache:JIT编译后的本地代码、JNI所使用的C代码
常用参数
- -Xms -Xmx 最小堆内存,最大堆内存
- -XX:NewSize -XX:MaxNewSize Young区大小,Young区最大大小
- -XX:NewRatio -XX:SurvivorRatio Young区和Old区的比率大小 Eden和Survivor区的比率大小
- -XX:MatespaceSize -XX:MaxMatespaceSize 指定Matespace大小
- -XX:+UseComperssedClassPointer 是否启用压缩的类指针,默认为1G大小
- -XX:CompressedClassSpaceSize 设置压缩类空间的大小
- -XX:InitialCodeCacheSize 指定CodeCache的大小
- -XX:ReservedCodeCacheSize 指定CodeCache的最大的大小
垃圾回收算法
思想:枚举根节点,做可达性分析
根节点:类加载器、Thread、虚拟机栈的本地变量表、static成员、常量引用、本地方法栈的变量等等
算法
- 标记清除
- 分为标记和清除两个阶段:首先标记出所有需要回收的对象,在标记完成后统一回收所有
- 缺点:效率不高(标记和清除效率不高)、容易产生碎片 (碎片多导致GC)
- 复制
- 将可用内存按容量划分为两个大小相同的两块,每次只使用其中的一块。当其中的一块的内存使用完了,就把还存活的对象复制到另一个内存中,然后再一次清除这个已经使用的所有内存
- 优缺点:实现简单、运行高效、但是空间利用率低,需要占用两块相同的内存空间
- 标记整理
- 标记过程与“标记清除”算法一样,但是后续的过程中不是直接清除对象,而是把所有的存活的对象都向一端进行移动,然后清理掉这以外的内存空间
- 优缺点:没有产生内存碎片,但是整理优化比较耗时
分代垃圾回收
- Young区使用复制算法
- Old区采用标记清除或者标记整理算法
对象分配
- 对象优先分配在Eden区分配
- 大对象直接进入Old区:-XX:PretenureSizeThreshold 指定多大的大对象直接进入Old区
- 长期存活的对象进入Old区:-XX:MaxTenuringThreshold -XX:+PrintTenuringDistribution -XX:TargetSurvivorRatio
垃圾收集器
- 串行收集器Serial:Serial、Serial Old
- 并行收集器Parallel:Parallel Scavenge、Parallel Old,吞吐量优先
- 并发收集器Concurrent:CMS、G1,停顿时间优先
并行VS并发
- 并行Parallel:指多条垃圾收集线程并行工作,但此时用户线程仍然处于等待状态。适合科学计算、后台处理等弱交互的场景
- 并发Concurrent:指用户线程与垃圾收集线程同时执行(但不一定是并行的,可能会交替执行),垃圾收集线程在执行的时候不会停顿用户线程的执行。适合对响应时间有要求的场景,比如Web
停顿时间VS吞吐量
- 停顿时间:垃圾收集器做垃圾回收中断应用的执行时间。-XX:MaxGCPauseMillis
- 吞吐量:花在垃圾收集的时间和花在应用时间的占比。-XX:GCTimeRatio=
, 垃圾收集时间占:1/1+n
串行收集器
- -XX:+UseSerialGC -XX:+UseSerialOldGC
并行收集器
- 吞吐量优先
- -XX:+UseParallelGC -XX:+UseParallelOldGC
- 在Serve模式下,这是默认的垃圾收集器
并发收集器
- 响应时间优先:
- CMS:-XX:+UseConcMarkSweepGC -XX:+UseParNewGC
- G1:-XX:+UseG1GC
垃圾收集器搭配
两个标准:
- 吞吐量=运行时间/总时间 关注GC耗时
- 停顿时间 关注每次GC造成的应用暂停
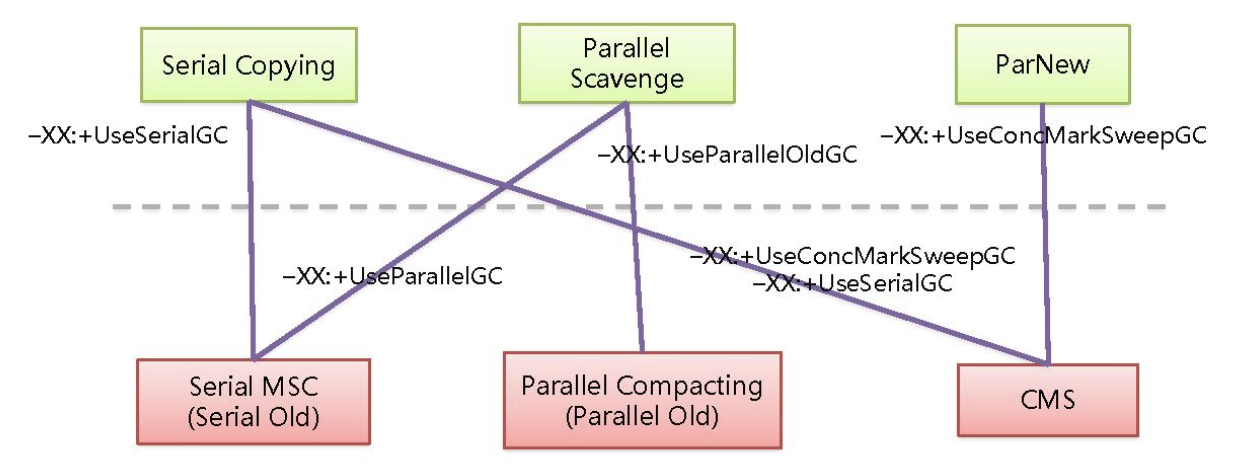
下面是Old区,上面是Young区,在JDK8中,无论是Young还是Old区,都可以使用G1垃圾收集器(JDK8中才有使用G1垃圾收集器)
如何选择垃圾收集器
- 优先调整堆得大小让服务器自己选择
- 如果内存小于100M,使用串行收集器
- 如果是单核,并且没有响应时间的要求,串行或者让JVM自己选择
- 如果允许停顿时间超过1秒,选择并行或者让JVM自己选择
- 如果响应时间最为重要且不能超过1秒,选择并发收集器
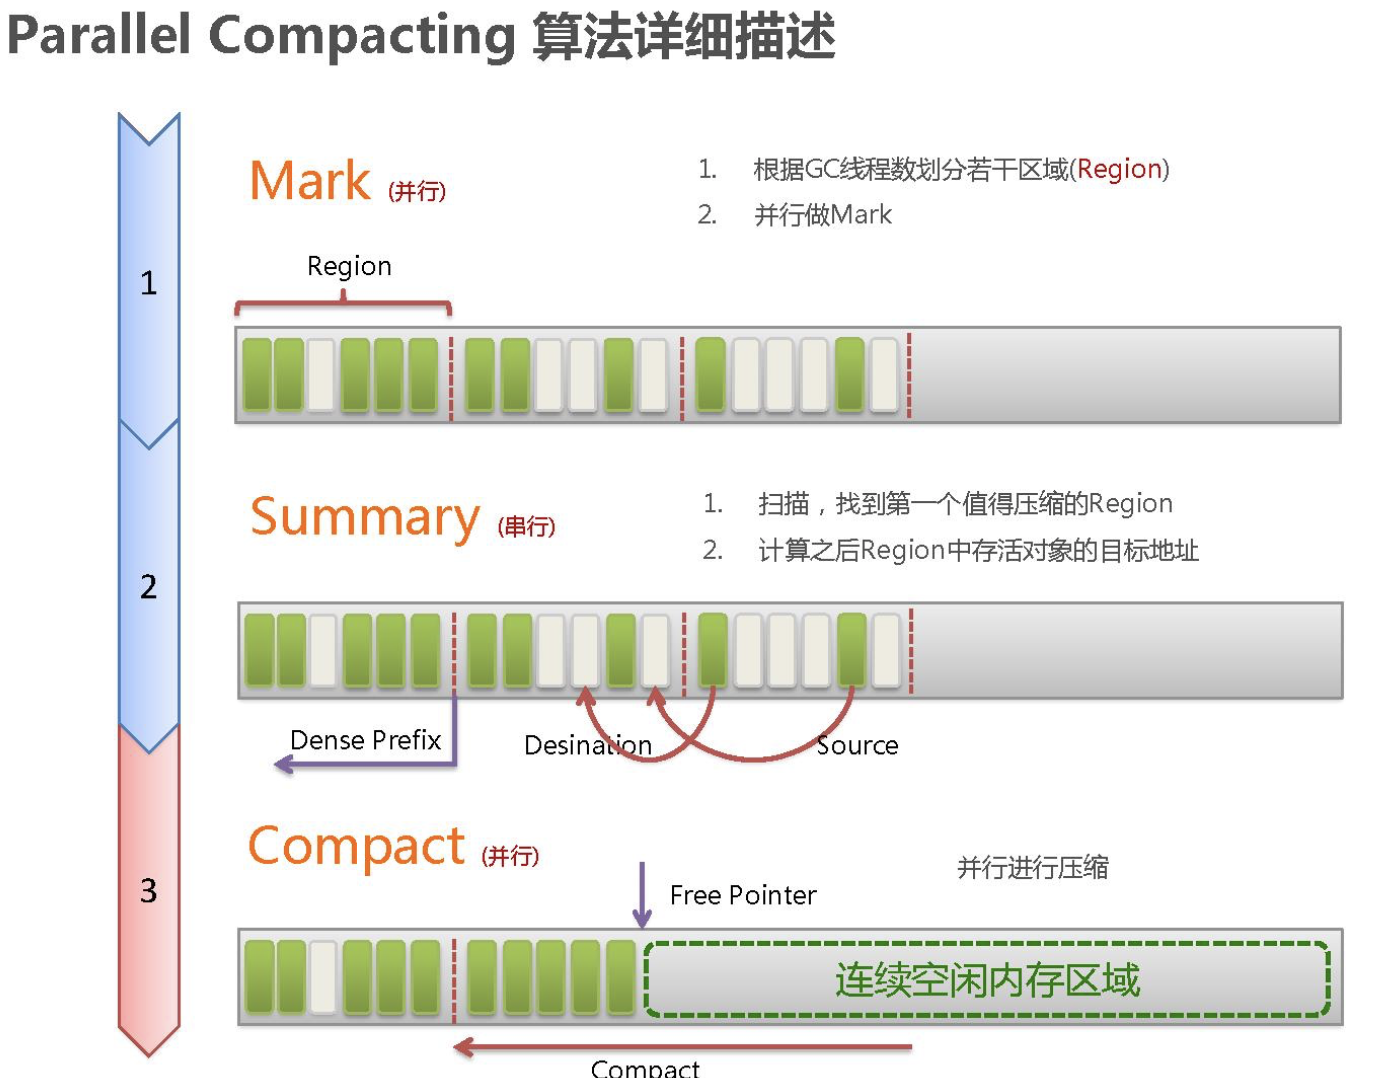
Parallel CollectioCollector
原理:当发现内存不够的时候,会暂停应用程序,启动多个垃圾收集线程做垃圾回收,然后在重新启动应用程序
-XX:+UseParallelGC 手动开启,Server默认开启
-XX:ParallelGCThreads=
开启多少个GC线程 CPU>8 N=5/8 CPU<8 N=CPU -XX:MaxGCPauseMillis=
最大停止时间 -XX:GCTimeRatio=
最大吞吐量 -Xmx
最大堆大小 使得垃圾收集器自适应
动态内存调整
-XX:YoungGenerationSizeIncrement=
-XX:TenuredGenerationSizeIncrement=
CMS Collector
- 并发收集
- 低停顿、低延迟
- 老年代收集器
CMS垃圾收集过程
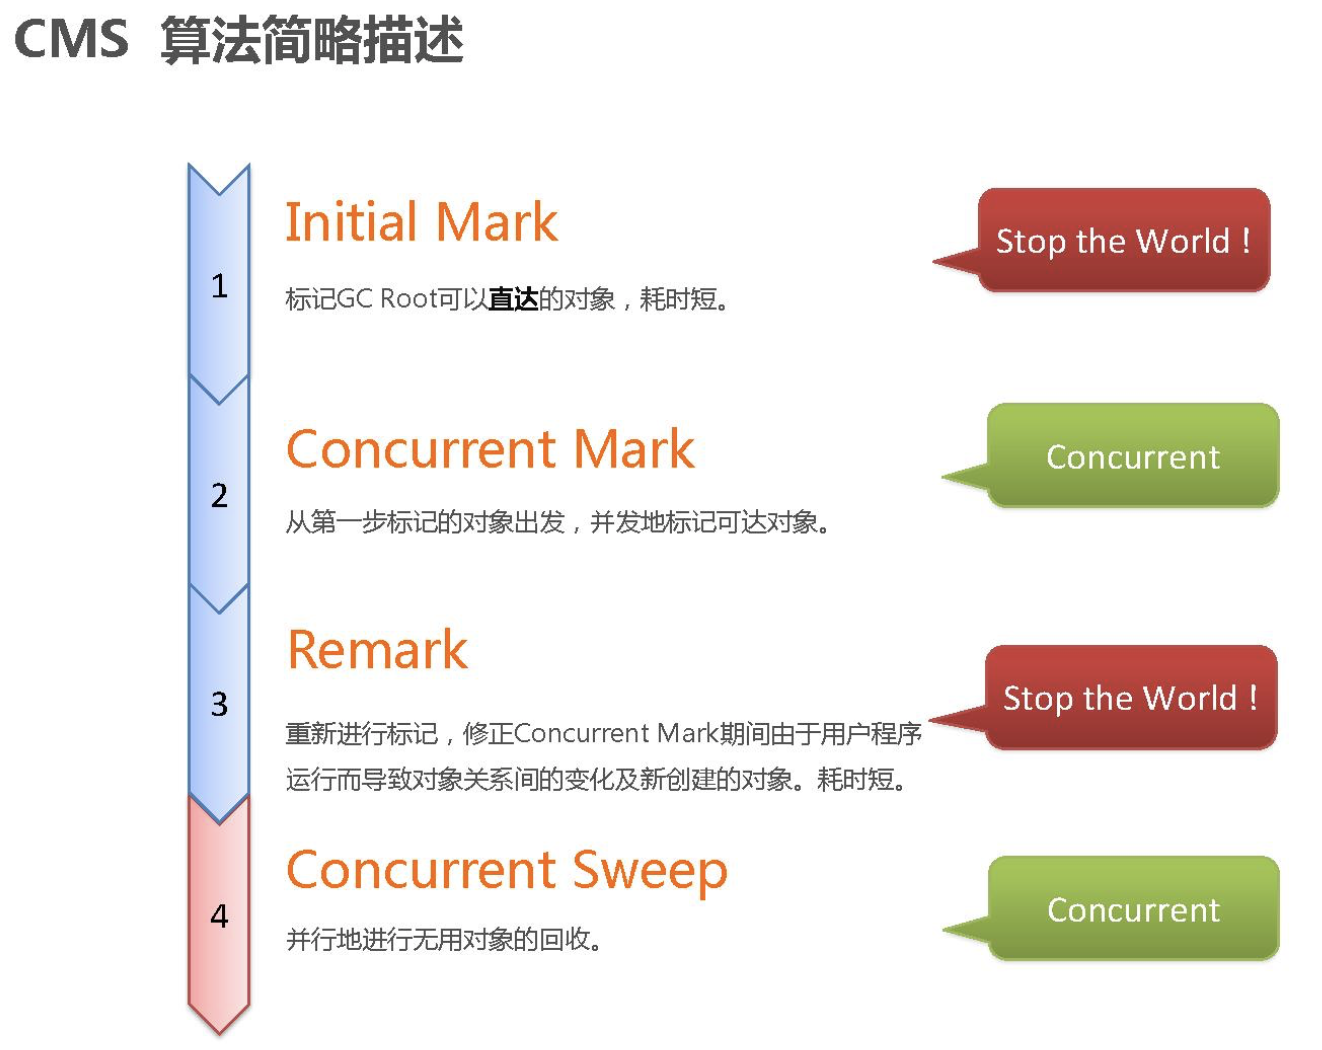
- CMS inital makr:初始化标记Root,STW(Stop The World需要停止应用程序)
- CMS Concurrent Mark :并发标记
- CMS remark:重新标记:STW
- CMS concurrent sweep:并发清除
缺点
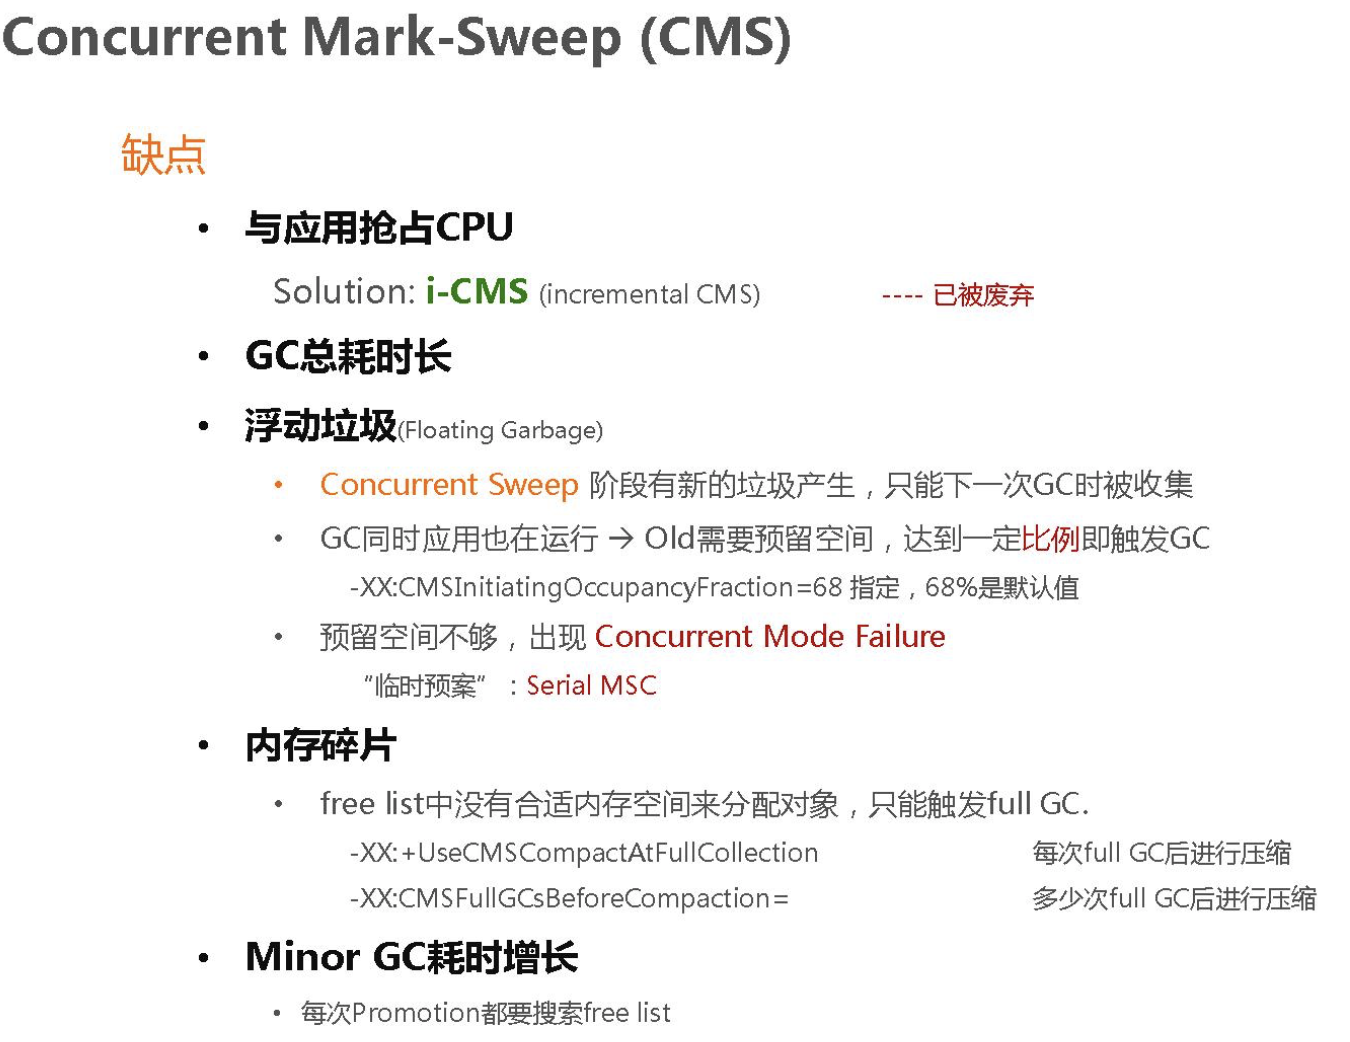
- CPU敏感 抢占CPU
- 浮动垃圾
- 内存空间碎片
- Minor GC耗时增长
CMS相关参数
- -XX:ConcGCTheads:并发的GC线程数
- -XX:+UseCMSCompactAtFullCollection:FullGC之后对内存做压缩,减少内存碎片
- -XX:CMSFullGCsBeforeCompaction 多少次FullGC之后压缩一次
- -XX:CMSInitiationOccupancyFraction Old区占满多少存活对象时才会触发一次FullGC 官方文档中默认为92%
- -XX:+UseCMSInInitiatingOccupancyOnly 是否是动态可调
- -XX:+CMSScavengeBeforeRemark FullGC之前是否是需要做一次YoungGC 一般会打开
- -XX:+CMSClassUnloadingEnabled 启用回收Perm区 JDK7以及之前
G1 Collector
简介:The first focus of G1 is to provide a solution for users running applications that require large heaps with limited GC latency. This means heap sizes of around 6 GB or larger, and a stable and predictable pause time below 0.5 seconds. —来自官网地址 Garbage-First Garbage Collector
翻译一下:G1垃圾收集器的着重点在于为那些堆内存大和延迟小的应用程序提供解决方案,这意味着堆的大小为6G或者更大,而且稳定的暂停时间为0.5秒
同时也是新生代和老生代的一个收集器
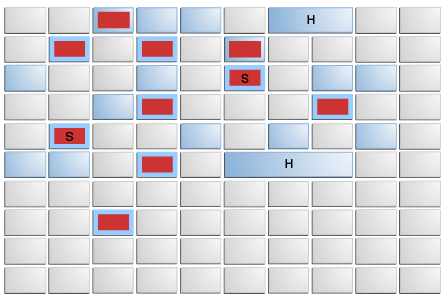
图来自官网地址
说明:
G1垃圾收集器中的也有Young区和Old区的概念,不过是一个逻辑上的概念。图中将G1分为一小块一小块的regions概念。浅蓝色为Young区中,在某些情况下,深蓝色的regions区域也在同一时刻进行GC,基于幸存对象的存活年龄,会把着标深蓝色的regions标记为幸存区的对象,也就是survivor,至于标记为H的,则是一些大对象
G1垃圾收集器调优地址Garbage-First Garbage Collector Tuning
常用参数
- -XX:+UseG1GC 开启G1
- -XX:G1HeapRegionSize=n Region的大小,1-32个,最多2048个
- -XX:MaxGCPPauseMillis=200 最大停顿时间
- -XX:G1NewSizePerent、+XX:G1MaxNewSizePerent Young区占比、最大占比
YoungGC
- 新对象进入Eden区
- 存活对象拷贝到survivor区
- 存活时间得到年龄的阈值时,直接晋升至Old区
Mixed GC
- 不是Full GC,回收所有的Young和部分的Old区
- 会进行全局的并发标记
- 时机:InitiatingHeapOccupancyPerent:堆占有率达到这个阈值时会进行触发并发标记,默认为45%
- G1HeapWastePerent:在全局并发标记后,可以知道多少空间要被回收,在每次YGC之后再次发生MixedGC之前,会检查垃圾占比是否达到此参数,只有达到了,下次才会发生MixedGC
最佳实践
- 年轻代大小:避免使用-Xmn、-XX:NewRatio等显示设置年轻代大小,会覆盖暂停时间目标
- 暂停时间目标:暂停时间不要求太苛刻,其吞吐量目标是90%的应用程序和10%的垃圾回收时间,太苛刻会影响到吞吐量
是否需要切换到G1
- 50%以上的堆被存活对象占用
- 对象晋升和分配的速度变化非常大
- 垃圾回收时间特别长,超过了1秒
调优
评价垃圾收集器的重要指标:
- 吞吐量
- 响应时间
垃圾回收官方指南Java Platform, Standard Edition HotSpot Virtual Machine Garbage Collection Tuning Guide
可视化GC日志分析工具
在线工具:https://gceasy.io/ GCViewer
打印GC相关日参数
- -XX:+PrintGCDetails -XX:+PrintGCTimeStamps -XX:+PrintGCDateStamps -XXloggc:$CATALINA_HOME/logs/gc.log -XX:+PrintHeapAtGC -XX:+PrintTenuringDistribution 打印GC详细信息,打印GC的时间,设置GC日志的文件路径,打印GC时堆信息,打印GC时对象的年龄情况
- 推荐使用GCViewer查看参数信息
可视化GC日志分析
GC调优步骤:
- 打印GC日志
- 根据日志得到关键性能指标
- 分析GC原因,调优JVM参数
初始化设置
- -XX:+DisableExplicitGC -XX:+HeapDumpOnOutOfMemoryError -XX:HeapDumpPath=$CATALINA_HOME/logs/ -XX:+PrintGCDetails -XX:+PrintGCTimeStamps -XX:+PrintGCDateStamps -XXloggc:CATALINA_HOME/logs/gc.log
Parallel GC调优的指导原则
Tuning Strategy(调优策略)
Do not choose a maximum value for the heap unless you know that you need a heap greater than the default maximum heap size. Choose a throughput goal that is sufficient for your application.
The heap will grow or shrink to a size that will support the chosen throughput goal. A change in the application’s behavior can cause the heap to grow or shrink. For example, if the application starts allocating at a higher rate, the heap will grow to maintain the same throughput.
If the heap grows to its maximum size and the throughput goal is not being met, the maximum heap size is too small for the throughput goal. Set the maximum heap size to a value that is close to the total physical memory on the platform but which does not cause swapping of the application. Execute the application again. If the throughput goal is still not met, then the goal for the application time is too high for the available memory on the platform.
If the throughput goal can be met, but there are pauses that are too long, then select a maximum pause time goal. Choosing a maximum pause time goal may mean that your throughput goal will not be met, so choose values that are an acceptable compromise for the application.
It is typical that the size of the heap will oscillate as the garbage collector tries to satisfy competing goals. This is true even if the application has reached a steady state. The pressure to achieve a throughput goal (which may require a larger heap) competes with the goals for a maximum pause time and a minimum footprint (which both may require a small heap).
——来源官网Ergonomics
除非确定,否则不要设置最大堆内存
优先设置吞吐量目标
如果吞吐量目标达不到,调大最大内存,不能让OS使用Swap,如果仍然达不到,降低目标
吞吐量达到,GC时间太长,设置停顿时间目标
G1调优指导
Recommendations
When you evaluate and fine-tune G1 GC, keep the following recommendations in mind:
- Young Generation Size: Avoid explicitly setting young generation size with the
-Xmnoption or any or other related option such as-XX:NewRatio. Fixing the size of the young generation overrides the target pause-time goal.- Pause Time Goals: When you evaluate or tune any garbage collection, there is always a latency versus throughput trade-off. The G1 GC is an incremental garbage collector with uniform pauses, but also more overhead on the application threads. The throughput goal for the G1 GC is 90 percent application time and 10 percent garbage collection time. Compare this to the Java HotSpot VM parallel collector. The throughput goal of the parallel collector is 99 percent application time and 1 percent garbage collection time. Therefore, when you evaluate the G1 GC for throughput, relax your pause time target. Setting too aggressive a goal indicates that you are willing to bear an increase in garbage collection overhead, which has a direct effect on throughput. When you evaluate the G1 GC for latency, you set your desired (soft) real-time goal, and the G1 GC will try to meet it. As a side effect, throughput may suffer. See the section Pause Time Goal in Garbage-First Garbage Collector for additional information.
- Taming Mixed Garbage Collections: Experiment with the following options when you tune mixed garbage collections. See the section Important Defaults for information about these options:
-XX:InitiatingHeapOccupancyPercent: Use to change the marking threshold.-XX:G1MixedGCLiveThresholdPercentand-XX:G1HeapWastePercent: Use to change the mixed garbage collection decisions.-XX:G1MixedGCCountTargetand-XX:G1OldCSetRegionThresholdPercent: Use to adjust the CSet for old regions.— 来源官网
- 年轻代大小:避免使用-Xmn、-XX:NewRatio等显示设置Young区大小,会覆盖暂停时间目标
- 暂停时间目标:暂停时间不要求太苛刻,其吞吐量目标是90%的应用程序和10%的垃圾回收时间,太苛刻会影响到吞吐量
- 关于Mixed GC参数调优
Java代码层优化
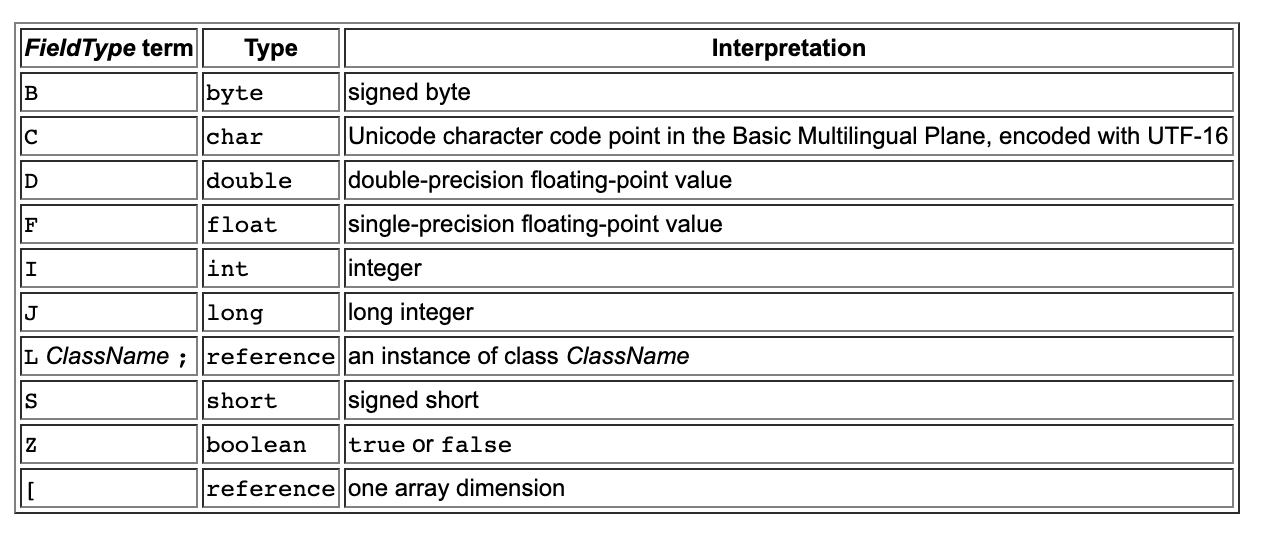
jvm字节码指令与javap
1 | [root@localhost bin]# javap |
实例说明:
1 | package com.lzh.demo.model; |
JVM是基于栈的架构,操作数栈和本地变量表来进行操作
i++与++i,字符串拼接+原理
i++:先引用再加1
++i:先加1再引用
循环中使用+拼接字符串效率低的原因是,每次都会new 一个StringBuilder
使用append,则不会
Try-Finally
使用字节码文件查看结果
String Constant Variable
- 类、方法、变量尽量指定final修饰
常用代码优化方法
- 尽量重用对象,不要循环创建对象,比如for循环字符串拼接
- 容器类初始化的时候一定要指定长度,避免扩容操作,比如List、Map
- ArrayList(数组)随机遍历快,LinkedList(双向链表)添加删除快
- 集合遍历尽量减少重复计算
- 使用Entry遍历Map
- 大数组复制用System.arraycopy
- 尽量使用基本类型而不是包装类型
- 不要手动调用System.gc()
- 及时消除过期对象的引用,防止内存泄漏
- 尽量使用局部变量,减小变量的作用域
- 尽量使用非同步容器ArrayList VS Vector
- 尽量减小同步作用范围,synchronized方法 VS synchronized代码块
- ThreadLocal缓存线程不安全的对象,SimpleDateFormat
- 尽量使用延迟加载
- 尽量减少反射,加缓存
- 尽量使用连接池、线程池、对象池、缓存
- 及时释放资源,I/O流、Socket、数据库连接
- 慎用异常,不要使用抛异常的方式来表明正常的业务逻辑
- String操作尽量减少使用正则表达式
- 日志输出注意使用不同的级别
- 日志参数中拼接使用占位符
- 批量操作数据对象